The Advent of Large Language Models and the Importance of Data Processing
Training and customizing large language models (LLMs) for high accuracy is fraught with challenges, primarily due to their dependency on high-quality data. Poor data quality and inadequate volume can significantly reduce model accuracy, making dataset preparation a critical task for AI developers.
Text Processing Pipelines and Best Practices
Dealing with the preprocessing of large data is nontrivial, especially when the dataset consists of mainly web-scraped data which is likely to contain large amounts of ill-formatted, low-quality data.
Download and Extract Text
The initial step in data curation involves downloading and preparing datasets from various common sources such as Common Crawl, specialized collections such as arXiv and PubMed, or private on-prime datasets, each potentially containing terabytes of data.
Preliminary Text Cleaning
Unicode fixing and language identification represent crucial early steps in the data curation pipeline, particularly when dealing with large-scale web-scraped text corpora.
Heuristic Filtering
Heuristic filtering employs rule-based metrics and statistical measures to identify and remove low-quality content.
Deduplication
Deduplication is a crucial step in data curation, particularly when dealing with large datasets that contain duplicate documents or similar content.
Data Processing for Building Sovereign LLMs
To fully meet customer needs, enterprises in non-English-speaking countries must go beyond generic models and customize them to capture the nuances of their local languages, ensuring a seamless and impactful customer experience.
Improve Data Quality with NVIDIA NeMo Curator
So far, we have discussed the importance of data quality in improving the accuracy of LLMs and explored various data processing techniques. Developers can now try these techniques directly through NeMo Curator.
Conclusion
In conclusion, data quality is a critical component in the development of accurate and effective large language models. By using techniques such as text processing pipelines, heuristic filtering, and deduplication, developers can ensure that their datasets are high-quality and suitable for model training. Additionally, NeMo Curator provides a customizable and modular interface that enables developers to build on top of it easily, speeding up workloads and reducing processing time.
Frequently Asked Questions
Q: What are some common challenges in training large language models?
A: Some common challenges in training large language models include high-quality data scarcity, dataset bias, and computational power limitations.
Q: What is the importance of text processing pipelines in large language model development?
A: Text processing pipelines are essential in large language model development as they enable developers to preprocess and clean large datasets, removing noise and inconsistencies that can negatively impact model accuracy.
Q: Can NeMo Curator be used to improve data quality?
A: Yes, NeMo Curator can be used to improve data quality by providing a customizable and modular interface that enables developers to build on top of it easily, speeding up workloads and reducing processing time.
Q: How does NeMo Curator accelerate data processing?
A: NeMo Curator accelerates data processing by using NVIDIA RAPIDS GPU-accelerated libraries like cuDF, cuML, and cuGraph, and Dask to speed up workloads on multinode multi-GPUs, reducing processing time and scale as needed.
To provide high-quality medical care to its population — around 30% of whom are 65 or older — Japan is pursuing sovereign AI initiatives supporting nearly every aspect of healthcare.
AI tools trained on country-specific data and local compute infrastructure are supercharging the abilities of Japan’s clinicians and researchers so they can care for patients, amid an expected shortage of nearly 500,000 healthcare workers by next year.
Breakthrough technology deployments by the country’s healthcare leaders — including in AI-accelerated drug discovery, genomic medicine, healthcare imaging and robotics — are highlighted at the NVIDIA AI Summit Japan, taking place in Tokyo through Nov. 13.
Drug Discovery AI Factories Deepen Understanding, Accuracy and Speed
NVIDIA is supporting Japan’s pharmaceutical market — one of the three largest in the world — with NVIDIA BioNeMo, an end-to-end platform that enables drug discovery researchers to develop and deploy AI models for generating biological intelligence from biomolecular data.
BioNeMo includes a customizable, modular programming framework and NVIDIA NIM microservices for optimized AI inference. New models include AlphaFold2, which predicts the 3D structure of a protein from its amino acid sequence; DiffDock, which predicts the 3D structure of a molecule interacting with a protein; and RFdiffusion, which designs novel protein structures likely to bind with a target molecule.
Japan’s Pharma Companies and Research Institutions Advance Drug Research and Development
Astellas, Daiichi-Sankyo and Ono Pharmaceutical are leading Japanese pharma companies harnessing the Tokyo-1 system, an NVIDIA DGX AI supercomputer built in collaboration with Xeureka, a subsidiary of the Japanese business conglomerate Mitsui & Co, to build AI models for drug discovery. Xeureka is using Tokyo-1 to accelerate AI model development and molecular simulations.
AI Scanners and Scopes Give Radiologists and Surgeons Real-Time Superpowers
Japan’s healthcare innovators are building AI-augmented systems to support radiologists and surgeons.
Fujifilm has developed an AI application in collaboration with NVIDIA to help surgeons perform surgery more efficiently.
Scaling Healthcare With Digital Health Agents
Older adults have higher rates of chronic conditions and use healthcare services the most — so to keep up with its aging population, Japan-based companies are at the forefront of developing digital health systems to augment patient care.
Fujifilm has launched NURA, a group of health screening centers with AI-augmented medical examinations designed to help doctors test for cancer and chronic diseases with faster examinations and lower radiation doses for CT scans.
Conclusion
Japan is leading the way in the adoption of AI in healthcare, with a focus on developing country-specific solutions to address the unique challenges faced by its aging population. From AI-accelerated drug discovery to digital health systems, Japan is leveraging AI to improve patient care and reduce the burden on its healthcare system.
FAQs
Q: What is NVIDIA BioNeMo?
A: NVIDIA BioNeMo is an end-to-end platform that enables drug discovery researchers to develop and deploy AI models for generating biological intelligence from biomolecular data.
Q: What is the Tokyo-1 system?
A: The Tokyo-1 system is an NVIDIA DGX AI supercomputer built in collaboration with Xeureka, a subsidiary of the Japanese business conglomerate Mitsui & Co, to build AI models for drug discovery.
Q: What is NURA?
A: NURA is a group of health screening centers with AI-augmented medical examinations designed to help doctors test for cancer and chronic diseases with faster examinations and lower radiation doses for CT scans.
Q: What is the NVIDIA Holoscan platform?
A: The NVIDIA Holoscan platform is a sensor processing platform that streamlines AI model and application development for real-time insights.
Singapore Sets Out AI’s Role in Retooling Its Economy
A Nation’s Push for Digital Transformation
In a bid to stay competitive in the global economy, Singapore has announced plans to leverage artificial intelligence (AI) to retool its economy. The city-state aims to harness the potential of AI to drive growth, create new job opportunities, and enhance productivity across various sectors.
Pilot Projects and Initiatives
The Singaporean government has launched several pilot projects and initiatives to demonstrate AI’s capabilities in various fields. For instance, it has partnered with local fintech companies to develop AI-powered chatbots for financial services. Additionally, AI-powered robots are being introduced in healthcare settings to provide personalized care and improve patient outcomes.
Upskilling and Reskilling
To ensure a seamless transition to an AI-driven economy, the government has also launched initiatives to upskill and reskill local workers. This includes programs aimed at equipping them with AI-related skills such as data analysis, programming, and machine learning.
New Jersey’s Democratic Governor on Trump’s Re-election and Tech Regulation
A Glimpse into the Future of Tech Policy
In a recent interview, New Jersey’s Democratic governor Phil Murphy shared his thoughts on Trump’s re-election and tech regulation. Murphy emphasized the need for a more stringent regulatory framework to ensure accountability and transparency in the tech industry.
Regulation and Accountability
Murphy believes that the tech industry needs to be held accountable for its actions, including issues related to data privacy and misinformation. He argues that the current regulatory environment is inadequate and that it is essential to establish new standards to protect consumers.
Politics and the Battle Against Misinformation
The Fight for Truth and Transparency
The spread of misinformation has become a growing concern in today’s digital age. Politicians from both sides of the aisle are grappling with the challenge of combating misinformation and maintaining transparency in the political arena.
The Role of Social Media
Social media platforms have been criticized for their role in spreading misinformation. Many experts argue that these platforms have failed to adequately address the issue and have instead chosen to amplify divisive rhetoric.
Conclusion
As the world navigates the complexities of an AI-driven economy, politics, and the battle against misinformation, it is clear that the stakes are higher than ever. It is essential for governments, politicians, and tech companies to work together to establish a more transparent and accountable environment.
FAQs
Q: What are the key initiatives launched by Singapore to leverage AI?
A: Singapore has launched several pilot projects and initiatives to demonstrate AI’s capabilities in various fields, including fintech, healthcare, and education.
Q: What is Governor Phil Murphy’s stance on Trump’s re-election?
A: Governor Phil Murphy has expressed concerns over Trump’s re-election, citing the need for a more stringent regulatory framework to ensure accountability and transparency in the tech industry.
Q: What is the role of social media in spreading misinformation?
A: Social media platforms have been criticized for their role in spreading misinformation, and many experts argue that these platforms have failed to adequately address the issue.
Social Media Chaos: Bluesky Hits 15 Million Users, But What’s the Future of Online Communities?
The Vergecast Tries to Make Sense of the Turbulent Landscape
Bluesky hit 15 million users this week, and then 16 million. The vibes on Bluesky are immaculate, and it seems to have a real and renewed chance to be the place that replaces Twitter for a lot of people. But then there’s Threads, which grew by approximately one Bluesky just this month. There’s also Mastodon, which is still hanging around, and of course there’s X. There are more options than ever, and it’s more confusing than ever.
Bluesky’s Growth: A Threat to ActivityPub and the Fediverse?
On this episode of The Vergecast, we try and make sense of all this change. Will all this new growth and momentum help Bluesky grow not just as an app but as a decentralized protocol? Is it a real threat to ActivityPub and the notion of the fediverse? Do we know yet what kind of social network wants to be? And if you’re looking for a place to post, like, reply, and read, where should you go? We don’t have all the answers, but we have plenty of ideas.
The Episode
(By the way: we recorded this episode on Wednesday, a little earlier than normal, and all of this is moving so fast that a couple of our numbers are out of date. Keep it locked on The Verge as things change!)
After that, The Verge’s Kylie Robison joins the show to help us pilot a new segment called “Show And Tell.” (It shouldn’t be called that – please help us rename it.) Each of the hosts brings a story they’re into right now and explains it to the rest of us, and then we all talk about it. We show and tell our way through Apple’s latest smart home plans, the AI model slowdown, and how it’s possible that “Just Eat sold Grubhub to Wonder” is a real sentence.
Links and Resources
If you want to know more about everything we discuss in this episode, here are some links to get you started, beginning with Bluesky and Threads and social:
Conclusion
The social media landscape is changing rapidly, with new platforms and features emerging every day. It’s more important than ever to stay informed and make sense of it all. We hope this episode has provided some insight into the latest developments and trends, and we look forward to continuing to explore the ever-changing world of social media.
FAQs
Q: What is Bluesky and why is it gaining popularity?
A: Bluesky is a decentralized social media platform that allows users to connect and share content without being owned by a single entity. It’s gaining popularity because it offers a new way for people to engage online without the constraints of traditional social media platforms.
Q: What is ActivityPub and the fediverse?
A: ActivityPub is a protocol that enables different social media platforms to communicate with each other. The fediverse is the collective network of social media platforms that use ActivityPub to connect and share content. Bluesky’s growth has raised questions about the future of ActivityPub and the fediverse.
Q: What is the show "Show And Tell" all about?
A: "Show And Tell" is a new segment on The Vergecast where the hosts share their latest obsessions and explain them to each other. The goal is to provide insight and context into the latest trends and developments in tech and beyond.
RAG is an approach that combines Gen AI LLMs with information retrieval techniques. Essentially, RAG allows LLMs to access external knowledge stored in databases, documents, and other information repositories, enhancing their ability to generate accurate and contextually relevant responses.
Why RAG is important for your organization
Traditional LLMs are trained on vast datasets, often called "world knowledge." However, this generic training data is not always applicable to specific business contexts. For instance, if your business operates in a niche industry, your internal documents and proprietary knowledge are far more valuable than generalized information.
How RAG works with vector databases
At the heart of RAG is the concept of vector databases. A vector database stores data in vectors, which are numerical data representations. These vectors are created through a process known as embedding, where chunks of data (for example, text from documents) are transformed into mathematical representations that the LLM can understand and retrieve when needed.
Practical steps to integrate RAG into your organization
Assess your data landscape: Evaluate the documents and data your organization generates and stores. Identify the key sources of knowledge that are most critical for your business operations.
Choose the right tools: Depending on your existing infrastructure, you may opt for cloud-based RAG solutions offered by providers like AWS, Google, Azure, or Oracle. Alternatively, you can explore open-source tools and frameworks that allow for more customized implementations.
Data preparation and structuring: Before feeding your data into a vector database, ensure it is properly formatted and structured. This might involve converting PDFs, images, and other unstructured data into an easily embedded format.
Implement vector databases: Set up a vector database to store your data’s embedded representations. This database will serve as the backbone of your RAG system, enabling efficient and accurate information retrieval.
Integrate with LLMs: Connect your vector database to an LLM that supports RAG. Depending on your security and performance requirements, this could be a cloud-based LLM service or an on-premises solution.
Test and optimize: Once your RAG system is in place, conduct thorough testing to ensure it meets your business needs. Monitor performance, accuracy, and the occurrence of any hallucinations, and make adjustments as needed.
Continuous learning and improvement: RAG systems are dynamic and should be continually updated as your business evolves. Regularly update your vector database with new data and re-train your LLM to ensure it remains relevant and effective.
Implementing RAG with open-source tools
Several open-source tools can help you implement RAG effectively within your organization:
LangChain: a versatile tool that enhances LLMs by integrating retrieval steps into conversational models.
LlamaIndex: an advanced toolkit that allows developers to query and retrieve information from various data sources.
Haystack: a comprehensive framework for building customizable, production-ready RAG applications.
Verba: an open-source RAG chatbot that simplifies exploring datasets and extracting insights.
Implementing RAG with major cloud providers
The hyperscale cloud providers offer multiple tools and services that allow businesses to develop, deploy, and scale RAG systems efficiently:
Amazon Web Services (AWS): Amazon Bedrock, Amazon Kendra, and Amazon SageMaker JumpStart.
Google Cloud: Vertex AI Vector Search, pgvector Extension in Cloud SQL and AlloyDB, and LangChain on Vertex AI.
Microsoft Azure: Azure Search, Azure Cognitive Search, and Azure Machine Learning.
Oracle Cloud Infrastructure (OCI): OCI Generative AI Agents and Oracle Database 23c.
Cisco Webex: Webex AI Agent and AI Assistant.
Considerations and best practices when using RAG
Integrating AI with business knowledge through RAG offers great potential but comes with challenges. Successfully implementing RAG requires more than just deploying the right tools. The approach demands a deep understanding of your data, careful preparation, and thoughtful integration into your infrastructure.
Conclusion
RAG is an innovative approach that enables organizations to harness the full potential of their data, providing a more efficient and accurate way to interact with AI-driven solutions. By following the practical steps outlined above and considering the challenges and best practices, your organization can successfully integrate RAG into its operations and unlock the benefits of enhanced business intelligence and decision-making capabilities.
FAQs
Q: What is RAG?
A: RAG is an approach that combines Gen AI LLMs with information retrieval techniques, allowing LLMs to access external knowledge stored in databases, documents, and other information repositories.
Q: Why is RAG important for my organization?
A: RAG allows organizations to harness the full potential of their data, providing a more efficient and accurate way to interact with AI-driven solutions.
Q: How does RAG work with vector databases?
A: RAG works with vector databases by creating numerical data representations of data chunks, which can be stored and retrieved efficiently, enabling accurate and contextually relevant responses.
Q: What are the practical steps to integrate RAG into my organization?
A: The practical steps include assessing your data landscape, choosing the right tools, data preparation and structuring, implementing vector databases, integrating with LLMs, testing and optimizing, and continuous learning and improvement.
Google’s Image Generator in Docs Now Available for Paid Workspace Accounts
Google’s image generator in Docs is now available to paid Workspace accounts that include the Gemini Business, Enterprise, Education, Education Premium, or Google One AI Premium add-ons.
How to Access the Feature
Those with the new feature can find it under Insert > Image > Help me create an image, which results in a “Create an image” sidebar where you can type in a description of what you’d like to make. It also provides a drop-down to select an art style with options such as “Photography” or “Sketch.”
Customizing Your Image
You can choose square, horizontal, or vertical aspect ratios for the images to best fit into the layout of your flier, brochure, menu, or whatever you’re trying to make. You can also create full-bleed cover images that span the width of a pageless document.
Rollout Schedule
The feature will roll out first to rapid release schedule domains beginning today and could take up to 15 days to appear. Meanwhile, domains on scheduled release will see a gradual rollout starting December 16th.
Conclusion
Google’s image generator in Docs is a powerful tool that can help you create high-quality images for your documents and presentations. With its ability to customize aspect ratios and art styles, you can create images that fit your specific needs and enhance your content.
FAQs
Q: What types of accounts have access to the image generator feature?
A: The feature is available to paid Workspace accounts that include the Gemini Business, Enterprise, Education, Education Premium, or Google One AI Premium add-ons.
Q: How do I access the image generator feature?
A: You can find the feature under Insert > Image > Help me create an image.
Q: Can I customize the aspect ratio of the images?
A: Yes, you can choose square, horizontal, or vertical aspect ratios for the images to best fit into the layout of your content.
Q: When will the feature be available to all accounts?
A: The feature will roll out first to rapid release schedule domains beginning today and could take up to 15 days to appear. Meanwhile, domains on scheduled release will see a gradual rollout starting December 16th.
Ensuring Student Safety and Wellness in K-12 Schools
Ensuring students are safe and holistically supported is a pressing concern for K-12 district and school administrators. As concerns about students’ health and wellbeing persist, schools are being looked at to help close the treatment gap that exists today with how they support student safety and wellness.
However, this imperative isn’t easily met. Many schools don’t have the resources needed to proactively identify and support student safety and wellness challenges. School counselors are stretched thin trying to support an average of 385 students each, with some supporting dozens and hundreds more. Even schools that have the allocated budget for mental health resources often struggle to find professionals to fill open roles.
The disparities between students’ mental health needs and the lack of resources to meet them leaves many students without the support they need. It also places an enormous burden on educators and administrators.
3 AI-Powered Tools that Help Schools Support Their Students’ Safety and Wellness
The use of artificial intelligence (AI) in educational settings can stir up concerns about academic integrity. However, few would disagree that schools need to figure out how to judiciously integrate AI into their learning environments or risk leaving students unprepared.
Beyond student applications of AI, there are many other ways AI can be applied in schools, including to support student safety and wellness. Here are three ways AI is helping resource-constrained student service teams be more effective and efficient.
Always-On Student Wellness Monitoring
AI-powered student wellness monitoring like Securly Aware utilizes sophisticated technologies and advanced algorithms to monitor students’ online activities for distress signals. By analyzing students’ interactions across email, social media, web searches, websites, and drives/files, student wellness monitoring can identify signs of self-harm, suicide, depression, violence, and bullying.
When a student demonstrates risk signals, student services staff are alerted so they can intervene quickly. Like an extra set of eyes and ears, student wellness monitoring helps student services teams triage and better support student safety and wellness concerns so they can prioritize students who need help now.
Continually Updated Student Wellness Levels
Wellness levels help schools take an even more proactive approach to student wellness. Using a proprietary, highly trained AI engine to analyze students’ online activities and trends, Securly Aware assigns each student a wellness level, starting at All Clear. As a student demonstrates increasing risk signals across their online activities, their wellness level will escalate in severity, moving to Concerning, then High Risk, then Critical.
The Aware dashboard (pictured above) provides a breakdown of the number of students in each level, giving administrators and student services teams a real-time "pulse check" of student safety and wellness in their district or school. They can easily drill down to the individual student level, as well as gain additional context to investigate and understand the risks involved.
Wellness levels also make it easy to identify students whose wellness levels have deteriorated. By providing early insight into potential risks, wellness levels help student services teams take proactive measures to support student safety and wellness before issues escalate.
Proactive Data Collection & Analysis
Schools and districts need access to timely and reliable data to proactively identify and support student needs. While they’ve traditionally looked to manual survey tools, the data these tools generate is historical and reflects only a snapshot in time.
Furthermore, when relying on manual survey methods, it can take weeks or months to analyze the data and derive insights. Once the data is finally actionable, it’s no longer an accurate representation of the current state.
Schools can eliminate the time and labor involved in manual surveying and start making data-driven decisions with AI-powered data collection and analysis. Securly Discern is a revolutionary AI that continually analyzes your students’ digital footprint to provide real-time insights to help better support student safety and wellness.
Conclusion
AI has the potential to revolutionize education in many ways. This includes helping K-12 schools create safer and more supportive environments for their students.
AI-driven tools like Securly Aware and Securly Discern give schools the much-needed ability to monitor, identify, and address student safety and wellness needs effectively and efficiently. With the help of these powerful, always-on AI-powered tools, schools are able to close the critical gap between growing student needs and dwindling school resources.
FAQs
Q: How can AI help schools support student safety and wellness?
A: AI can help schools monitor student online activities, identify risk signals, and provide real-time insights to support student safety and wellness.
Q: What is Securly Aware and how does it help schools?
A: Securly Aware is an AI-powered student wellness monitoring tool that helps schools identify signs of self-harm, suicide, depression, violence, and bullying, and alerts student services staff so they can intervene quickly.
Q: What is Securly Discern and how does it help schools?
A: Securly Discern is a revolutionary AI that continually analyzes students’ digital footprint to provide real-time insights to help better support student safety and wellness.
Q: How can schools get started with AI-powered student safety and wellness tools?
A: Schools can get started by registering for a personalized demo of Securly Aware and Securly Discern.
Google Introduces New AI-Powered Features for Google Assistant: Google has announced the introduction of new AI-powered features for its Google Assistant, including the ability to recognize and respond to voice commands in multiple languages.
Microsoft Launches New AI-Powered Tool for Developers: Microsoft has launched a new AI-powered tool for developers, designed to help them build more intelligent and interactive applications.
Industry News
Amazon Acquires AI Startup to Enhance Alexa Capabilities: Amazon has acquired an AI startup to enhance the capabilities of its Alexa virtual assistant.
Facebook Launches New AI-Powered Tool for Content Moderation: Facebook has launched a new AI-powered tool to help its moderators review and remove harmful content from the platform.
Research and Development
New Study Reveals AI Can Predict Human Behavior: A new study has revealed that AI can predict human behavior with a high degree of accuracy, opening up new possibilities for applications such as customer service and marketing.
Researchers Develop New AI Algorithm for Image Recognition: Researchers have developed a new AI algorithm for image recognition that is more accurate and efficient than previous methods.
Deals and Discounts
Check out Hostinger’s Black Friday Deal: Hostinger is offering a special Black Friday deal on its web hosting services, with discounts of up to 90% off.
Conclusion
This week’s AI news has seen a number of exciting developments, from new features for Google Assistant to the acquisition of an AI startup by Amazon. The research and development sector has also seen significant progress, with the development of new AI algorithms and the prediction of human behavior. Whether you’re a developer, a business owner, or simply an AI enthusiast, there’s been plenty to keep you up to date with the latest AI news.
FAQs
Q: What are the new features for Google Assistant?
A: The new features for Google Assistant include the ability to recognize and respond to voice commands in multiple languages.
Q: What is the new AI-powered tool for developers launched by Microsoft?
A: The new AI-powered tool for developers is designed to help them build more intelligent and interactive applications.
Q: What is the purpose of the new AI-powered tool for content moderation launched by Facebook?
A: The new AI-powered tool is designed to help Facebook moderators review and remove harmful content from the platform.
Q: What is the new study about AI predicting human behavior?
A: The study reveals that AI can predict human behavior with a high degree of accuracy, opening up new possibilities for applications such as customer service and marketing.
Q: What is the new AI algorithm for image recognition developed by researchers?
A: The new AI algorithm is more accurate and efficient than previous methods, and has the potential to be used in a wide range of applications.
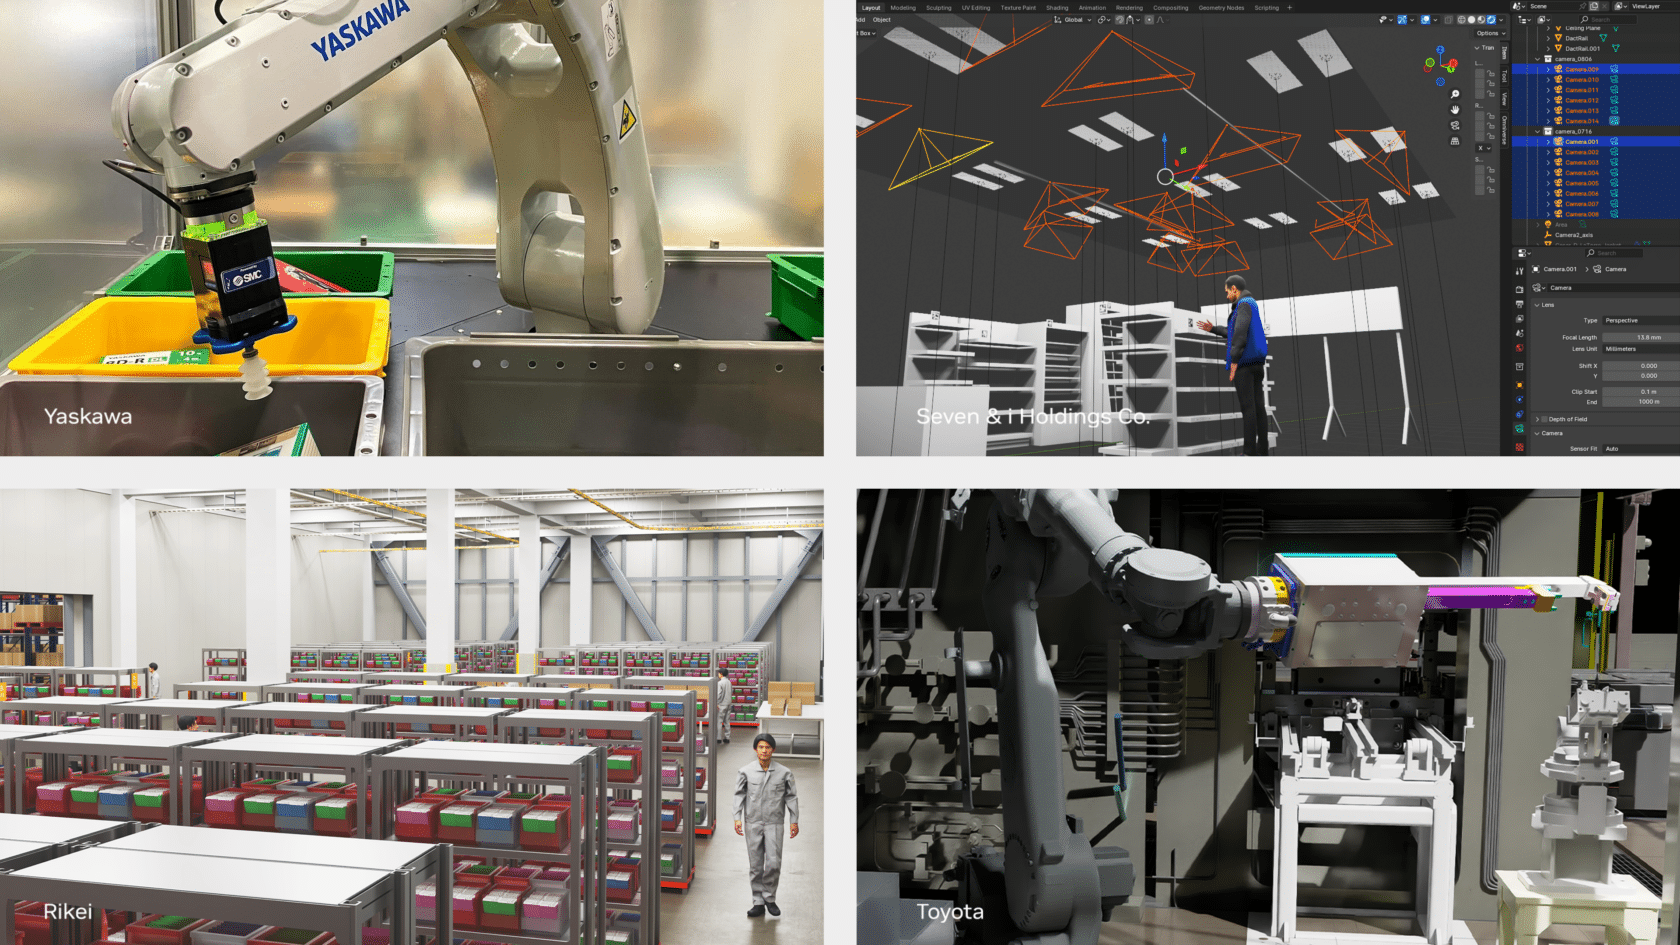
Robots transporting heavy metal at a Toyota plant. Yaskawa’s robots working alongside human coworkers in factories. To advance efforts like these virtually, Rikei Corporation develops digital twin tooling to assist planning.
And if that weren’t enough, diversified retail holdings company Seven & i Holdings is running digital twin simulations to enhance customer experiences.
Physical AI and industrial AI, powered by NVIDIA Omniverse and Isaac and Metropolis, are propelling Japan’s industrial giants into the future. Such pioneering moves in robotic manipulation, industrial inspection and digital twins for human assistance are on full display at NVIDIA AI Summit Japan this week.
Looking Into the Future With Toyota Robotics
Toyota is tapping into NVIDIA Omniverse for physics simulation for robot motion and gripping to improve its metal forging capabilities. That’s helping to reduce the time it takes to teach robots to transport forging materials.
Toyota is verifying to reproduce its robotic work handling and robot motion with the accuracy of NVIDIA PhysX with Omniverse. Omniverse enables modeling digital twins of factories and other environments that accurately duplicate the physical characteristics of objects and systems in the real world, which is foundational to building physical AI for driving next-generation autonomous systems.
Advantages of Omniverse
Omniverse enables Toyota to model things like mass properties, gravity and friction for comparing results with physical representations of tests. This can help work in manipulation and robot motion.
It also allows Toyota to replicate the expertise of its senior employees with robotics for issues requiring a high degree of skills. And it increases safety and throughput since factory personnel are not required to work in the high temperatures and harsh environments associated with metal-forging production lines.
Driving Automation, Yaskawa Harnesses NVIDIA Isaac
Yaskawa is a leading global robotics manufacturer that has shipped more than 600,000 robots and offers nearly 200 robot models, including industrial robots for the automotive industry, collaborative robots and dual-arm robots.
The Japanese robotics leader is expanding into new markets with its MOTOMAN NEXT adaptive robot, which is moving into task adaptation, versatility and flexibility. Driven by advanced robotics enabled by the NVIDIA Isaac and Omniverse platforms, Yaskawa’s adaptive robots are focused on delivering automation for the food, logistics, medical and agriculture industries.
Advantages of Isaac
Using NVIDIA Isaac Manipulator, a reference workflow of NVIDIA-accelerated libraries and AI models, Yaskawa is integrating AI to its industrial arm robots, giving them the ability to complete a wide range of industrial automation tasks.
Yaskawa is using FoundationPose for precise 6D pose estimation and tracking. These AI models enhance the adaptability and efficiency of Yaskawa’s robotic arms, and the motion control enables sim-to-real transition, making them versatile and effective at performing complex tasks across a wide range of industries.
Creating Customer Experiences at Seven & i Holdings With Omniverse, Metropolis
Seven & i Holdings is one of the largest Japanese diversified retail holdings companies. The Japanese retail company runs a proof of concept to understand customer behaviors at its retail outlets with digital simulation.
Seven & i Holdings is pushing its research activities by tapping into NVIDIA Omniverse and NVIDIA Metropolis to better understand operations across its retail stores. Using NVIDIA Metropolis, a set of developer tools for building vision AI applications, store operations are analyzed with computer vision models, helping improve efficiency and safety.
Advantages of Metropolis
Combining digital twins with price recognition, object tracking and other AI-based computation enables it to generate useful behavioral insights about retail environments and customer interactions. Such information offers opportunities to dynamically generate and show personalized ads on digital signage displays targeted to customers.
The retailer plans to use Metropolis and the NVIDIA Merlin recommendation engine framework to create tailored suggestions to individual shoppers, responding to customer interests — based on data — like never before.
Virtually Revolutionizing, Rikei Corporation Launches Asset Library for Digital Twins
Rikei Corporation, a systems solutions provider, specializes in spatial computing and extended reality technology for the manufacturing sector.
The technology company has developed JAPAN USD Factory, which is a digital twin asset library specifically for the Japanese manufacturing industry. Developed on NVIDIA Omniverse, JAPAN USD Factory reproduces materials and equipment commonly used in manufacturing sites across Japan in a digital form so that Japanese manufacturers can more easily build digital twins of their factories and warehouses.
Advantages of JAPAN USD Factory
Rikei Corporation aims to streamline various stages of design, simulation and operations for the manufacturing process with these digital assets to enhance productivity with digital twins.
Developed with OpenUSD, a universal 3D asset interchange, JAPAN USD Factory allows developers to access its asset libraries for things like palettes and racks, offering seamless integration across tools and workflows.
Conclusion
Japan is at the forefront of industrial innovation, leveraging physical AI and industrial AI to drive advancements in robotic manipulation, industrial inspection, and digital twins for human assistance. With the help of NVIDIA Omniverse, Isaac, and Metropolis, Japanese companies like Toyota, Yaskawa, and Seven & i Holdings are revolutionizing their industries and setting the stage for a brighter future.
FAQs
Q: What is NVIDIA Omniverse?
A: NVIDIA Omniverse is a platform that enables the creation of digital twins, which are exact replicas of physical environments, allowing for simulation, testing, and optimization of complex systems.
Q: What is NVIDIA Isaac?
A: NVIDIA Isaac is a platform that enables the development of advanced robotics, including manipulation, inspection, and autonomous systems.
Q: What is NVIDIA Metropolis?
A: NVIDIA Metropolis is a set of developer tools for building vision AI applications, enabling the analysis of store operations and customer behaviors.
Q: What is JAPAN USD Factory?
A: JAPAN USD Factory is a digital twin asset library specifically for the Japanese manufacturing industry, developed on NVIDIA Omniverse, which reproduces materials and equipment commonly used in manufacturing sites across Japan.
This article is part of the Circuits thread, an experimental format collecting invited short articles and critical commentary delving into the inner workings of neural networks.
Naturally Occurring Equivariance in Neural Networks
Curve Circuits
Introduction
Some of the neurons in vision models are features that we aren’t particularly surprised to find. Curve detectors, for example, are a pretty natural feature for a vision system to have. In fact, they had already been discovered in the animal visual cortex. It’s easy to imagine how curve detectors are built up from earlier edge detectors, and it’s easy to guess why curve detection might be useful to the rest of the neural network.
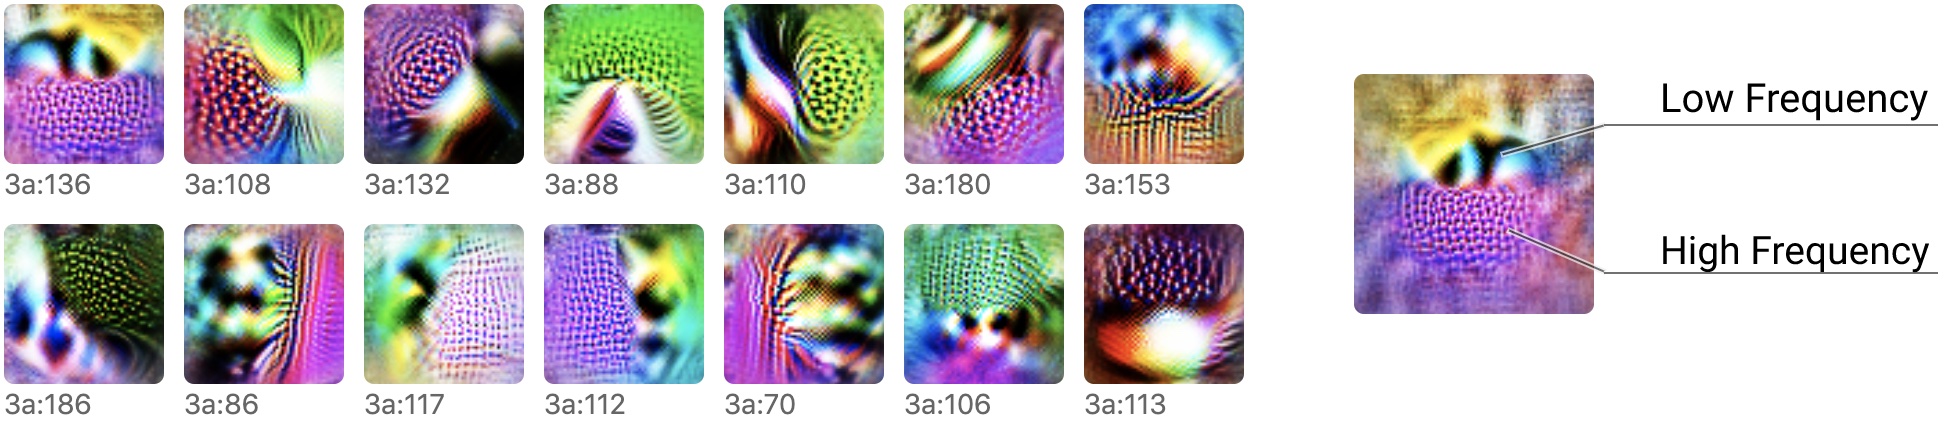
High-low frequency detectors, on the other hand, seem more surprising. They are not a feature that we would have expected a priori to find. Yet, when systematically characterizing the early layers of InceptionV1, we found a full fifteen neurons of mixed3a that appear to detect a high frequency pattern on one side, and a low frequency pattern on the other.
One worry we might have about the circuits approach to studying neural networks is that we might only be able to understand a limited set of highly-intuitive features.
High-low frequency detectors demonstrate that it’s possible to understand at least somewhat unintuitive features.
How can we be sure that “high-low frequency detectors” are actually detecting directional transitions from low to high spatial frequency?
We will rely on three methods:
Later on in the article, we dive into the mechanistic details of how they are both implemented and used. We will be able to understand the algorithm that implements them, confirming that they detect high to low frequency transitions.
A feature visualization is a synthetic input
optimized to elicit maximal activation of a single, specific neuron.
Feature visualizations are constructed starting from random noise, so each and every pixel in a feature visualization
that’s changed from random noise is there because it caused the neuron to activate more strongly. This
establishes a causal link! The behavior shown in the
feature visualization is behavior that causes the neuron to fire:
1:
Feature visualizations of a variety of high-low frequency detectors from InceptionV1′s mixed3a layer.
From their feature visualizations, we observe that all of these high-low frequency detectors share these same
characteristics:
Detection of adjacent high and low frequencies. The detectors respond to high frequency on one side, and low frequency on the other side.
Rotational equivariance.
The detectors are rotationally equivariant: each unit detects a high-low frequency change along a particular angle, with different units spanning the full 360º of possible orientations.
We will see this in more detail when we construct a tuning curve with synthetic examples, and also when we look at the weights implementing these detectors.
We can use a diversity term in our feature visualizations to jointly optimize for the activation of a neuron while encouraging different activation patterns in a batch of visualizations.
We are thus reasonably confident that if high-low frequency detectors were also sensitive to other patterns, we would see signs of them in these feature visualizations. Instead, the frequency contrast remains an invariant aspect of all these visualizations. (Although other patterns form along the boundary, these are likely outside the neuron’s effective receptive field.)
1-2:
Feature visualizations of high-low frequency detector mixed3a:136 from InceptionV1′s mixed3a
layer, optimized with a diversity objective. You can learn more about feature visualization and the diversity objective here.
We generate dataset examples by sampling from a natural data distribution (in this case, the training set) and selecting the images that cause the neurons to maximally activate.
Checking against these examples helps ensure we’re not misreading the feature visualizations.
2:
Crops taken from Imagenet where mixed3a 136 activated maximally,
argmaxed over spatial locations.
A wide range of real-world situations can cause high-low frequency detectors to fire. Oftentimes it’s a highly-textured, in-focus foreground object against a blurry background — for example, the foreground might be the microphone’s latticework, the hummingbird’s tiny head feathers, or the small rubber dots on the Lenovo ThinkPad pointing stick — but not always: we also observe that it fires for the MP3 player’s brushed metal finish against its shiny screen, or the text of a watermark.
In all cases, we see one area with high frequency and another area with low frequency. Although they often fire at an object boundary,
they can also fire in cases where there is a frequency change without an object boundary.
High-low frequency detectors are therefore not the same as boundary detectors.
Tuning curves show us how a neuron’s response changes with respect to a parameter.
They are a standard method in neuroscience, and we’ve found them very helpful for studying artificial neural networks as well. For example, we used them to demonstrate how the response of curve detectors changes with respect to orientation.
Similarly, we can use tuning curves to show how high-low frequency detectors respond.
To construct such a curve, we’ll need a set of synthetic stimuli which cause high-low frequency detectors to fire.
We generate images with a high-frequency pattern on one side and a low-frequency pattern on the other. Since we’re interested in orientation, we’ll rotate this pattern to create a 1D family of stimuli:
The first axis of variation of our synthetic stimuli is orientation.
But what frequency should we use for each side? How steep does the difference in frequency need to be?
To explore this, we’ll add a second dimension varying the ratio between the two frequencies:
The second axis of variation of our synthetic stimuli is the frequency ratio.
(Adding a second dimension will also help us see whether the results for the first dimension are robust.)
Now that we have these two dimensions, we sample the synthetic stimuli and plot each neuron’s responses to them:
Each high-low frequency detector exhibits a clear preference for a limited range of orientations.
As we previously found with curve detectors, high-low frequency detectors are rotationally equivariant: each one selects for a given orientation, and together they span the full 360º space.
How are high-low frequency detectors built up from lower-level neurons?
One could imagine many different circuits which could implement this behavior. To give just one example, it seems like there are at least two different ways that the oriented nature of these units could form.
Equivariant→Equivariant Hypothesis. The first possibility is that the previous layer already has precursor features which detect oriented transitions from high frequency to low frequency. The extreme version of this hypothesis would be that the high-low frequency detector is just an identity passthrough of some lower layer neuron. A more moderate version would be something like what we see with curve detectors, where early curve detectors become refined into the larger and more sophisticated late curve detectors. Another example would be how edge detection is built up from simple Gabor filters which were already oriented.
We call this Equivariant→Equivariant because the equivariance over orientation was already there in the previous layer.
Invariant→Equivariant Hypothesis. Alternatively, previous layers might not have anything like high-low frequency detectors. Instead, the orientation might come from spatial arrangements in the neuron’s weights that govern where it is excited by low-frequency and high-frequency features.
To resolve this question — and more generally, to understand how these detectors are implemented — we can look at the weights.
Let’s look at a single detector. Glancing at the weights from conv2d2 to mixed3a 110, most of them can be roughly divided into two categories: those that activate on the left and inhibit on the right, and those that do the opposite.
4:
Six neurons from conv2d2 contributing weights to mixed3a 110.
The same also holds for each of the other high-low frequency detectors — but, of course, with different spatial patternsAs an aside: The 1-2-1 pattern on each column of weights is curiously reminiscent of the structure of the Sobel filter. on the weights, implementing the different orientations.
Surprisingly, across all high-low frequency detectors, the two clusters of neurons that we get for each are actually the same two clusters! One cluster appears to detect textures with a generally high frequency, and one cluster appears to detect textures with a generally low frequency.
5:
The strongest weights on any high-low frequency detector (here shown: mixed3a 110, mixed3a 136, and mixed3a 112) can be divided into roughly two clusters. Each cluster contributes its weights in similar ways.
This is exactly what we would expect to see if the Invariant→Equivariant hypothesis is true: each high-low frequency detector composes the same two components in different spatial arrangements, which then in turn govern the detector’s orientation.
These two different clusters are really striking.
In the next section, we’ll investigate them in more detail.
High and Low Frequency Factors
It would be nice if we could confirm that these two clusters of neurons are real. It would also be nice if we could create a simpler way to represent them for circuit analysis later.
Factorizing the connectionsBetween two adjacent layers, “connections” reduces to the weights
between the two layers. Sometimes we are interested in observing connectivity between layers that may not be
directly adjacent. Because our model, a deep convnet, is non-linear, we will need to approximate the
connections. A simple approach that we take is to linearize the model by removing the non-linearities. While
this is not a great approximation of the model’s behavior, it does give a reasonable intuition for
counterfactual influence: had the neurons in the intermediate layer fired, how it would have affected neurons in
the downstream layers. We treat positive and negative influences separately. between lower layers and the high-low frequency detectors is one way that we can check whether these two clusters are meaningful, and investigate their significance. Performing a one-sided non-negative matrix factorization (NMF)We require that the channel factor be positive, but allow the spatial factor to have both positive and negative values. separates the connections into two factors.
Each factor corresponds to a vector over neurons. Feature visualization can also be used to visualize these linear combinations of neurons. Strikingly, one clearly displays a generic high-frequency image, whereas the other does the same with a low-frequency image.In InceptionV1 in particular, it’s possible that we recover these two factors so crisply in part due to the 3×3 bottleneck between conv2d2 and mixed3a. Because of this, we’re not here looking at direct weights between conv2d2 and mixed3a, but rather the “expanded weights,” which are a product of a 1×1 convolution (which reduces down to a small number of neurons) combined with a 3×3 convolution. This structure is very similar to the factorization we apply. However, as we see later in Universality, we recover similar factors for other models where this bottleneck doesn’t exist. NMF makes it easy to see this abstract circuit across many models which may not have an architecture that more explicitly reifies it. We’ll call these the HF-factor and the LF-factor:
6:
NMF recovers the neurons that contribute to the two NMF factors plus the weighted amount they contribute to
each factor. Here shown: NMF against both conv2d2 and a deeper layer, conv2d1. The
left side of the equal sign shows feature visualizations of the NMF factors.
The feature visualizations are suggestive, but how can we be sure that these factors really correspond to high and low frequency in general, rather than specific high or low frequency patterns? One thing we can do is to create synthetic stimuli again, but now plotting the responses of those two NMF factors.
Since our factors don’t correspond to an edge, our synthetic stimuli will only have one frequency region for each stimulus. To add a second dimension and again demonstrate robustness, we also vary the rotation of that region. (The frequency texture is not exactly rotationally invariant because we construct the stimulus out of orthogonal cosine waves.)
Unlike last time, these activations now mostly ignore the image’s orientation, but are sensitive to its frequency. We can average these results over all orientations in order to produce a simple tuning curve of how each factor responds to frequency. As predicted, the HF-factor responds to high frequency and the LF-factor responds to low frequency.
8:
Tuning curve for HF-factor and LF-factor from conv2d2 against images with synthetic frequency, averaged across orientation. Wavelength as a proportion of the full input image ranges from 1:1 to 1:10.
Now that we’ve confirmed what these factors are, let’s look at how they’re combined into high-low frequency detectors.
Construction of High-Low Frequency Detectors
NMF factors the weights into both a channel factor and a spatial factor. So far, we’ve looked at the two parts of the channel factor. The spatial factor shows the spatial weighting that combines the HF and LF factors into high-low frequency detectors.
Unsurprisingly, these weights basically reproduce the same pattern that we’d previously been seeing in Figure 5 from its two different clusters of neurons: where the HF-factor inhibits, the LF-factor activates — and vice versa.
As an aside, the HF-factor here for InceptionV1 (as well as some of its NMF components, like conv2d2 123) also appears to be lightly activated by bright greens and magentas. This might be responsible for the feature visualizations of these high-low frequency detectors showing only greens and magentas on the high-frequency side.
HF-factor
LF-factor
HF-factor
LF-factor
9:
Using NMF factorization on the weights connecting six high-low frequency detectors in InceptionV1 to the
two directly
preceding convolutional layers, conv2d2 and conv2d1.
Their spatial arrangement is very clear, with LF factors activating
areas in which high-low frequency detectors expect low frequencies, and inhibiting areas in which they expect high frequencies. The two
factors
are very close to symmetric. Weight magnitudes normalized between -1 and 1.
High-low frequency detectors are therefore built up by circuits that arrange high frequency detection on one side and low frequency detection on the other.
There are some exceptions that aren’t fully captured by the NMF factorization perspective. For example, conv2d2 181 is a texture contrast detector that appears to already have spatial structure.
This is the kind of feature that we would expect to be involved through an Equivariant→Equivariant circuit.
If that were the case, however, we would expect its weights to the high-low frequency detector mixed3a 70 to be a solid positive stripe down the middle.
What we instead observe is that it contributes as a component of high frequency detection, though perhaps with a slight positive overall bias.
Although conv2d2 181 has a spatial structure, perhaps it responds more strongly to high frequency patterns.
The weights from conv2d2 181 to mixed3a 70 are consistent with conv2d2 181 contributing via the HF-factor, not via the existing spatial structure of its texture contrast detection.
Now that we understand how they are constructed, how are high-low frequency detectors used by higher-level features?
mixed3b is the next layer immediately after the high-low frequency detectors. Here, high-low frequency detectors contribute to a variety of features. Their most important role seems to be supporting boundary detectors, but they also contribute to bumps and divots, line-like and curve-like shapes,
and at least one each of center-surrounds, patterns, and textures.
10:
Examples of neurons that high-low frequency detectors contribute to: (1) mixed3b 345 (a boundary detector), (2) mixed3b 276 (a center-surround texture detector), (3) mixed3b 314 (a double boundary detector), and (4) mixed3b 365 (an hourglass shape detector).
These aren’t the only contributors to these neurons – for example, mixed3b 276 also relies heavily on certain center-surrounds and textures – but they are strong contributors.
Oftentimes, downstream features appear to ignore the “polarity” of a high-low frequency detector, responding roughly the same way regardless of which side is high frequency. For example, the vertical boundary detector mixed3b 345 (see above) is strongly excited by high-low frequency detectors that detect frequency change across a vertical line in either direction.
Whereas activation from a high-low frequency detector can help detect boundaries between different objects, inhibition from a high-low frequency detector can also add structure to an object detector by detecting regions that must be contiguous along some direction — essentially, indicating the absence of a boundary.
11:
Some of mixed3b 314’s weights, extracted for emphasis. Orientation doesn’t matter so much for how these weights are used by mixed3b 314, but their 180º-invariant orientation does!
You may notice that strong excitation (left) is correlated with the presence of a boundary at a particular angle, whereas strong inhibition (right) is correlated with object continuity where a boundary might otherwise have been.
As we’ve mentioned, by far the primary downstream contribution of high-low frequency detectors is to boundary detectors. Of the top 20 neurons in mixed3b with the highest L2-norm of weights across all high-low frequency detectors, eight of those 20 neurons participate in boundary detection of some sort: double boundary detectors, miscellaneous boundary detectors, and especially object boundary detectors.
Role in object boundary detection
Object boundary detectors are neurons which detect boundaries between objects, whether that means the boundary between one object and another or the transition from foreground to background. They are different from edge detectors or curve detectors: although they are sensitive to edges (indeed, some of their strongest weights are contributed by lower-level edge detectors!), object boundary detectors are also sensitive to other indicators such as color contrast and high-low frequency detection.
12: mixed3b 345 is a boundary detector activated by high-low frequency detectors, edges, color contrasts, and end-of-line
detectors. It is specifically sensitive to vertically-oriented high-low frequency detectors, regardless of their
orientation, and along a vertical line of positive weights.
High-low frequency detectors contribute to these object boundary detectors by providing one piece of evidence that an object has ended and something else has begun. Some examples of object boundary detectors are shown below, along with their weights to a selection of high-low frequency detectors, grouped by orientation (ignoring polarity).
In particular, note how similar the weights are within each grouping! This shows us again that the later layers ignore the high-low frequency detectors’ polarity. Furthermore, the arrangement of excitatory and inhibitory weights contributes to each boundary detector’s overall shape, following the principles outlined above.
Beyond mixed3b, high-low frequency detectors ultimately play a role in detecting more sophisticated object shapes in mixed4a and beyond, by continuing to contribute to the detection of boundaries and contiguity.
So far, the scope of our investigation has been limited to InceptionV1.
How common are high-low frequency detectors in convolutional neural networks generally?
Universality
High-Low Frequency Detectors in Other Networks
It’s always good to ask if what we see is the rule or an interesting exception — and high-low frequency detectors seem to be the rule.
High-low frequency detectors similar to ones in InceptionV1 can be found in a variety of architectures.
14. High-low frequency detectors that we’ve found in AlexNet, InceptionV4, and ResnetV2-50 (right), compared to their most similar counterpart from InceptionV1 (left). These are individual neurons, not linear combinations approximating the detectors in InceptionV1.
Notice that these detectors are found at very similar depths within the different networks, between 29% and 33% network depth!Network depth is here defined as the index of the layer divided by the total number of layers. While the particular orientations each network’s high-low frequency detectors respond to may vary slightly, each network has its own family of detectors that together cover the full 360º and comprise a rotationally equivariant family. Architecture aside – what about networks trained on substantially different datasets? In the extreme case, one could imagine a synthetic dataset where high-low frequency detectors don’t arise. For most practical datasets, however, we expect to find them. For example, we even find some candidate high-low frequency detectors in AlexNet (Places): down-up, left-right, and up-down.
Even though these families are from three completely different networks, we also discover that their high-low frequency detectors are built up from high and low frequency components.
HF-factor and LF-factor in Other Networks
As we did with InceptionV1, we can again perform NMF on the weights of the high-low frequency detectors in each network in order to extract the strongest two factors.
The feature visualizations of the two factors reveal one clear HF-factor and one clear LF-factor, just like what we found in InceptionV1. Furthermore, the weights on the two factors are again very close to symmetric.
Our earlier conclusions therefore also hold across these different networks: high-low frequency detectors are built up from the specific spatial arrangement of a high frequency component and a low frequency component.
Conclusion
Although high-low frequency detectors represent a feature that we didn’t necessarily expect to find in a neural network, we find that we can still explore and understand them using the interpretability tools we’ve built up for exploring circuits: NMF, feature visualization, synthetic stimuli, and more.
We’ve also learned that high-low frequency detectors are built up from comprehensible lower-level parts, and we’ve shown how they contribute to later, higher-level features.
Finally, we’ve seen that high-low frequency detectors are common across multiple network architectures.
Given the universality observations, we might wonder whether the existence of high-low frequency detectors isn’t so unnatural after all. We even find approximate high-low frequency detectors in AlexNet Places, with its substantially different training data. Beyond neural networks, the aesthetic quality imparted by the blurriness of an out-of-focus region of an image is already known as to photographers as bokeh. And in VR, visual blur can either provide an effective depth-of-field cue or, conversely, can induce nausea in the user when implemented in a dissonant way. Perhaps frequency detection might well be commonplace in both natural and artificial vision systems as yet another type of informational cue.
Nevertheless, whether their existence is natural or not, we find that high-low frequency detectors are possible to characterize and understand.
This article is part of the Circuits thread, a collection of short articles and commentary by an open scientific collaboration delving into the inner workings of neural networks.
Naturally Occurring Equivariance in Neural Networks
Curve Circuits
.Organize the content with appropriate headings and subheadings ( h2, h3, h4, h5, h6). Include conclusion section and FAQs section with Proper questions and answers at the end. do not include the title. it must return only article i dont want any extra information or introductory text with article e.g: ” Here is rewritten article:” or “Here is the rewritten content:”[/gpt3]



/cdn.vox-cdn.com/uploads/chorus_asset/file/25735020/VST_111524_Site.jpg "Bluesky’s Big Week")

/cdn.vox-cdn.com/uploads/chorus_asset/file/25290329/STK255_Google_Gemini_A.jpg "Google’s AI Clip Art for Documents")